Blog
08 02, 2023
{{ content.title }}
{{ content.description }}
Understanding a utility bill is essential knowledge for anyone who has a stake in energy use at an organization. Many organizations view energy as a fixed cost and aren’t fully aware of the many different ways they can reduce their energy spend. By explaining the line items found on an energy bill and diving deeper into the distinction between energy and demand charges, this post will help you better understand how to unlock significant savings on your bill.
What are energy (kWh) and demand (kW) charges?
The cost of purchasing and delivering power varies greatly depending on your tariff structure. Even within the same utility, organizations of different sizes, industries, and load profiles will be charged different rates based on the tariff they are on. There are a host of factors influencing this cost, including which supply resources are meeting the marginal demand, how much congestion there is on the grid, weather, supply availability, and more.
Some of these cost components increase with consumption, called energy charges. Energy charges are straightforward – they are simply based on the total amount of electricity your organization consumes over a billing period. More kWh consumed leads to more charges.
In contrast, capacity or demand charges are based on your organization’s peak usage during a specific time window – typically peak usage hours on the grid -- regardless of how much you consume at other times. Increased demand during this window costs you more because:
- The transmission company has to build infrastructure to get the electricity to your utility.
- The utility also has to supply you with bigger, more expensive equipment to get the electricity into your building.
- Consuming 5,000 kW of electricity, for example, requires a lot more infrastructure than consuming 500 kW does.
Put another way, you are paying the grid operator to have the capacity to meet your peak demand, even if you rarely use your largest expected amount. To use an analogy, think about consumption as the number that registers on your car’s odometer – to tell you how far you’ve driven – and demand as what is captured on your speedometer when you hit your max speed. Consumption is your overall electricity use, and demand is your peak intensity, or maximum “speed.”
When you consume energy matters
Within either category of charges (energy or demand), there’s a further difference based on when your organization consumes the energy. Time-of-use energy charges are levied based on consumption during on-peak and off-peak time windows. These in turn reflect the time in the day of greatest and least system stress (e.g., based on system-wide supply and demand conditions). This is because on-peak hours are more expensive to service – they are associated with a higher energy rate than off-peak hours. You can see this demonstrated in the bottom right panel of the figure below. To reduce your energy charges without changing your overall consumption during that time, you can shift your consumption from on-peak to off-peak hours.
Energy Charges = On-Peak Usage x Peak Energy Rate + Off-Peak Demand x Peak Demand Rate
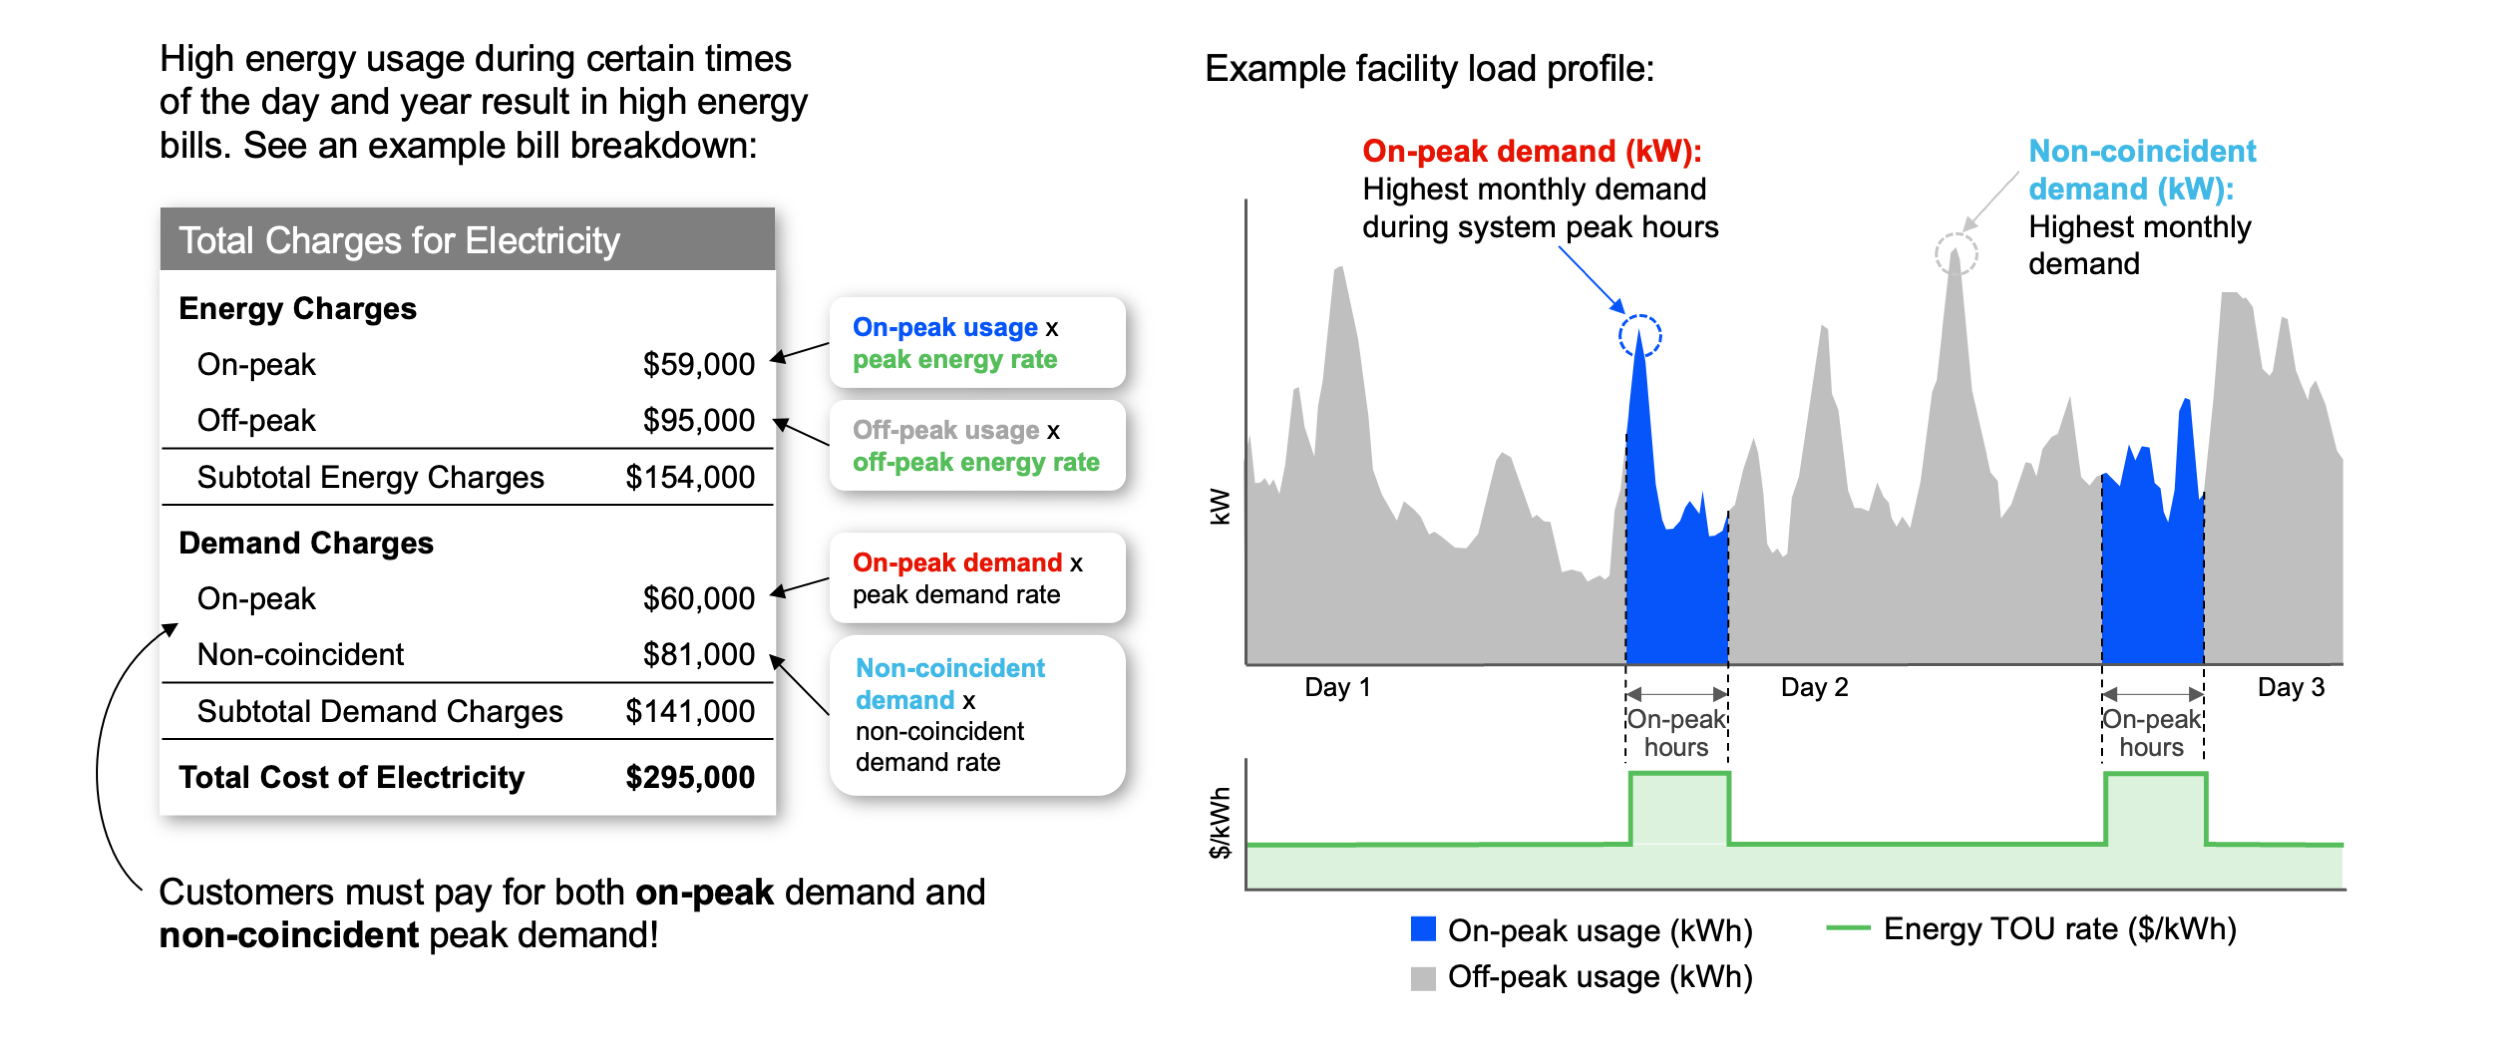
For capacity charges, there are coincident and non-coincident charges, relative to the system-wide demand. Non-coincident peak simply refers to your highest instantaneous demand during the month of your billing period. To reduce this, you can change the time of some of your operations around to shave your peaks and “flatten” your overall energy consumption.
Demand Charges = On-Peak Demand x Peak Demand Rate + Non-Coincident Demand x Non-Coincident Demand Rate
Coincident peak charges: What are they?
Coincident or system “on-peak demand” refers to your organization’s demand during system-wide peak hours. Because you won’t know ahead of time which hour the system peak will occur, coincident peaks are a bit harder to manage.
To ultimately sell and deliver energy to your facility, your energy supplier must purchase generation capacity to serve your load and transmission capacity to deliver the energy. You, as an energy consumer, are then billed for the amount you’re expected to owe for your portion of the supplier’s total generation and transmission charges – that is what is reflected on your utility bill.
For generation capacity, auctions are held within each RTO to determine the capacity price for a given delivery period. In PJM, for instance, system peak charges are based on a customer’s capacity tag (capacity Peak Load Contribution, or PLC). PLCs are calculated for each electricity user based on their average electricity demand (kW) during the overall grid system’s 5 highest demand hours (across different days) – this has historically taken place in the summer months.
System peak charges only occur in de-regulated regions, but other regions have their own rules for calculating system peak charges. For example, New England’s (ISO-NE) system peak charges are based on the single highest hour per year, and charges for ERCOT in Texas are based on what it calls the 4 Critical Peaks (4CP).
For transmission capacity, or the ability to deliver energy to the end-use customer, rates are set by each transmission owner. For example, the transmission charge in AEP (PJM) can be set on the one coincident peak hour of demand in the end-user’s utility zone and is adjusted and finalized by the distribution utility. The market operators in New York (NYISO) and New England (ISO-NE) base their capacity charges on the single peak hour within the network.
Coincident peak charges: What can you do about it?
If you intend to manage your coincident capacity and transmission charges, you must purchase your electricity through a supplier that offers a pass-through of these charges. For instance, in PJM you can work with a third-party supplier to set up a contract structure that discretely bills you for capacity and transmission based on your coincident peak contribution. Then, you can reduce your demand and save on your energy bills by curtailing consumption during the 5 hours of the summer with highest demand on the system (5 hours for capacity and 1, 5, or 12 hours for transmission, depending on your utility zone).
Enel can assist you across regions by helping to predict the grid’s system peak hours to help you save on a significant portion of your bill. Demand response can also be concurrent with system peaks, resulting in incremental benefits by participating in demand response programs through lower capacity tags.
Illustrative example from a customer in PJM
Now that we have the 10,000 foot view, let’s get down to the nitty-gritty of deconstructing an actual organization’s electricity bills. The sample bills (anonymized and rounded) are from an industrial site in PJM. Because the company contracts with a third-party supplier for a mix of fixed price contracts and indexed contracts, there are two electricity bills for the period:
- One from the supplier, Direct Energy, which relates to the energy the customer has directly purchased from the supplier, representing 84% of the total electricity spend
- One from the distribution utility bill, ComEd, which relates to the utility charges for providing “last mile” distribution as well as acting as the provider of last resort, representing 16% of the total spend
Illustrative example energy bill
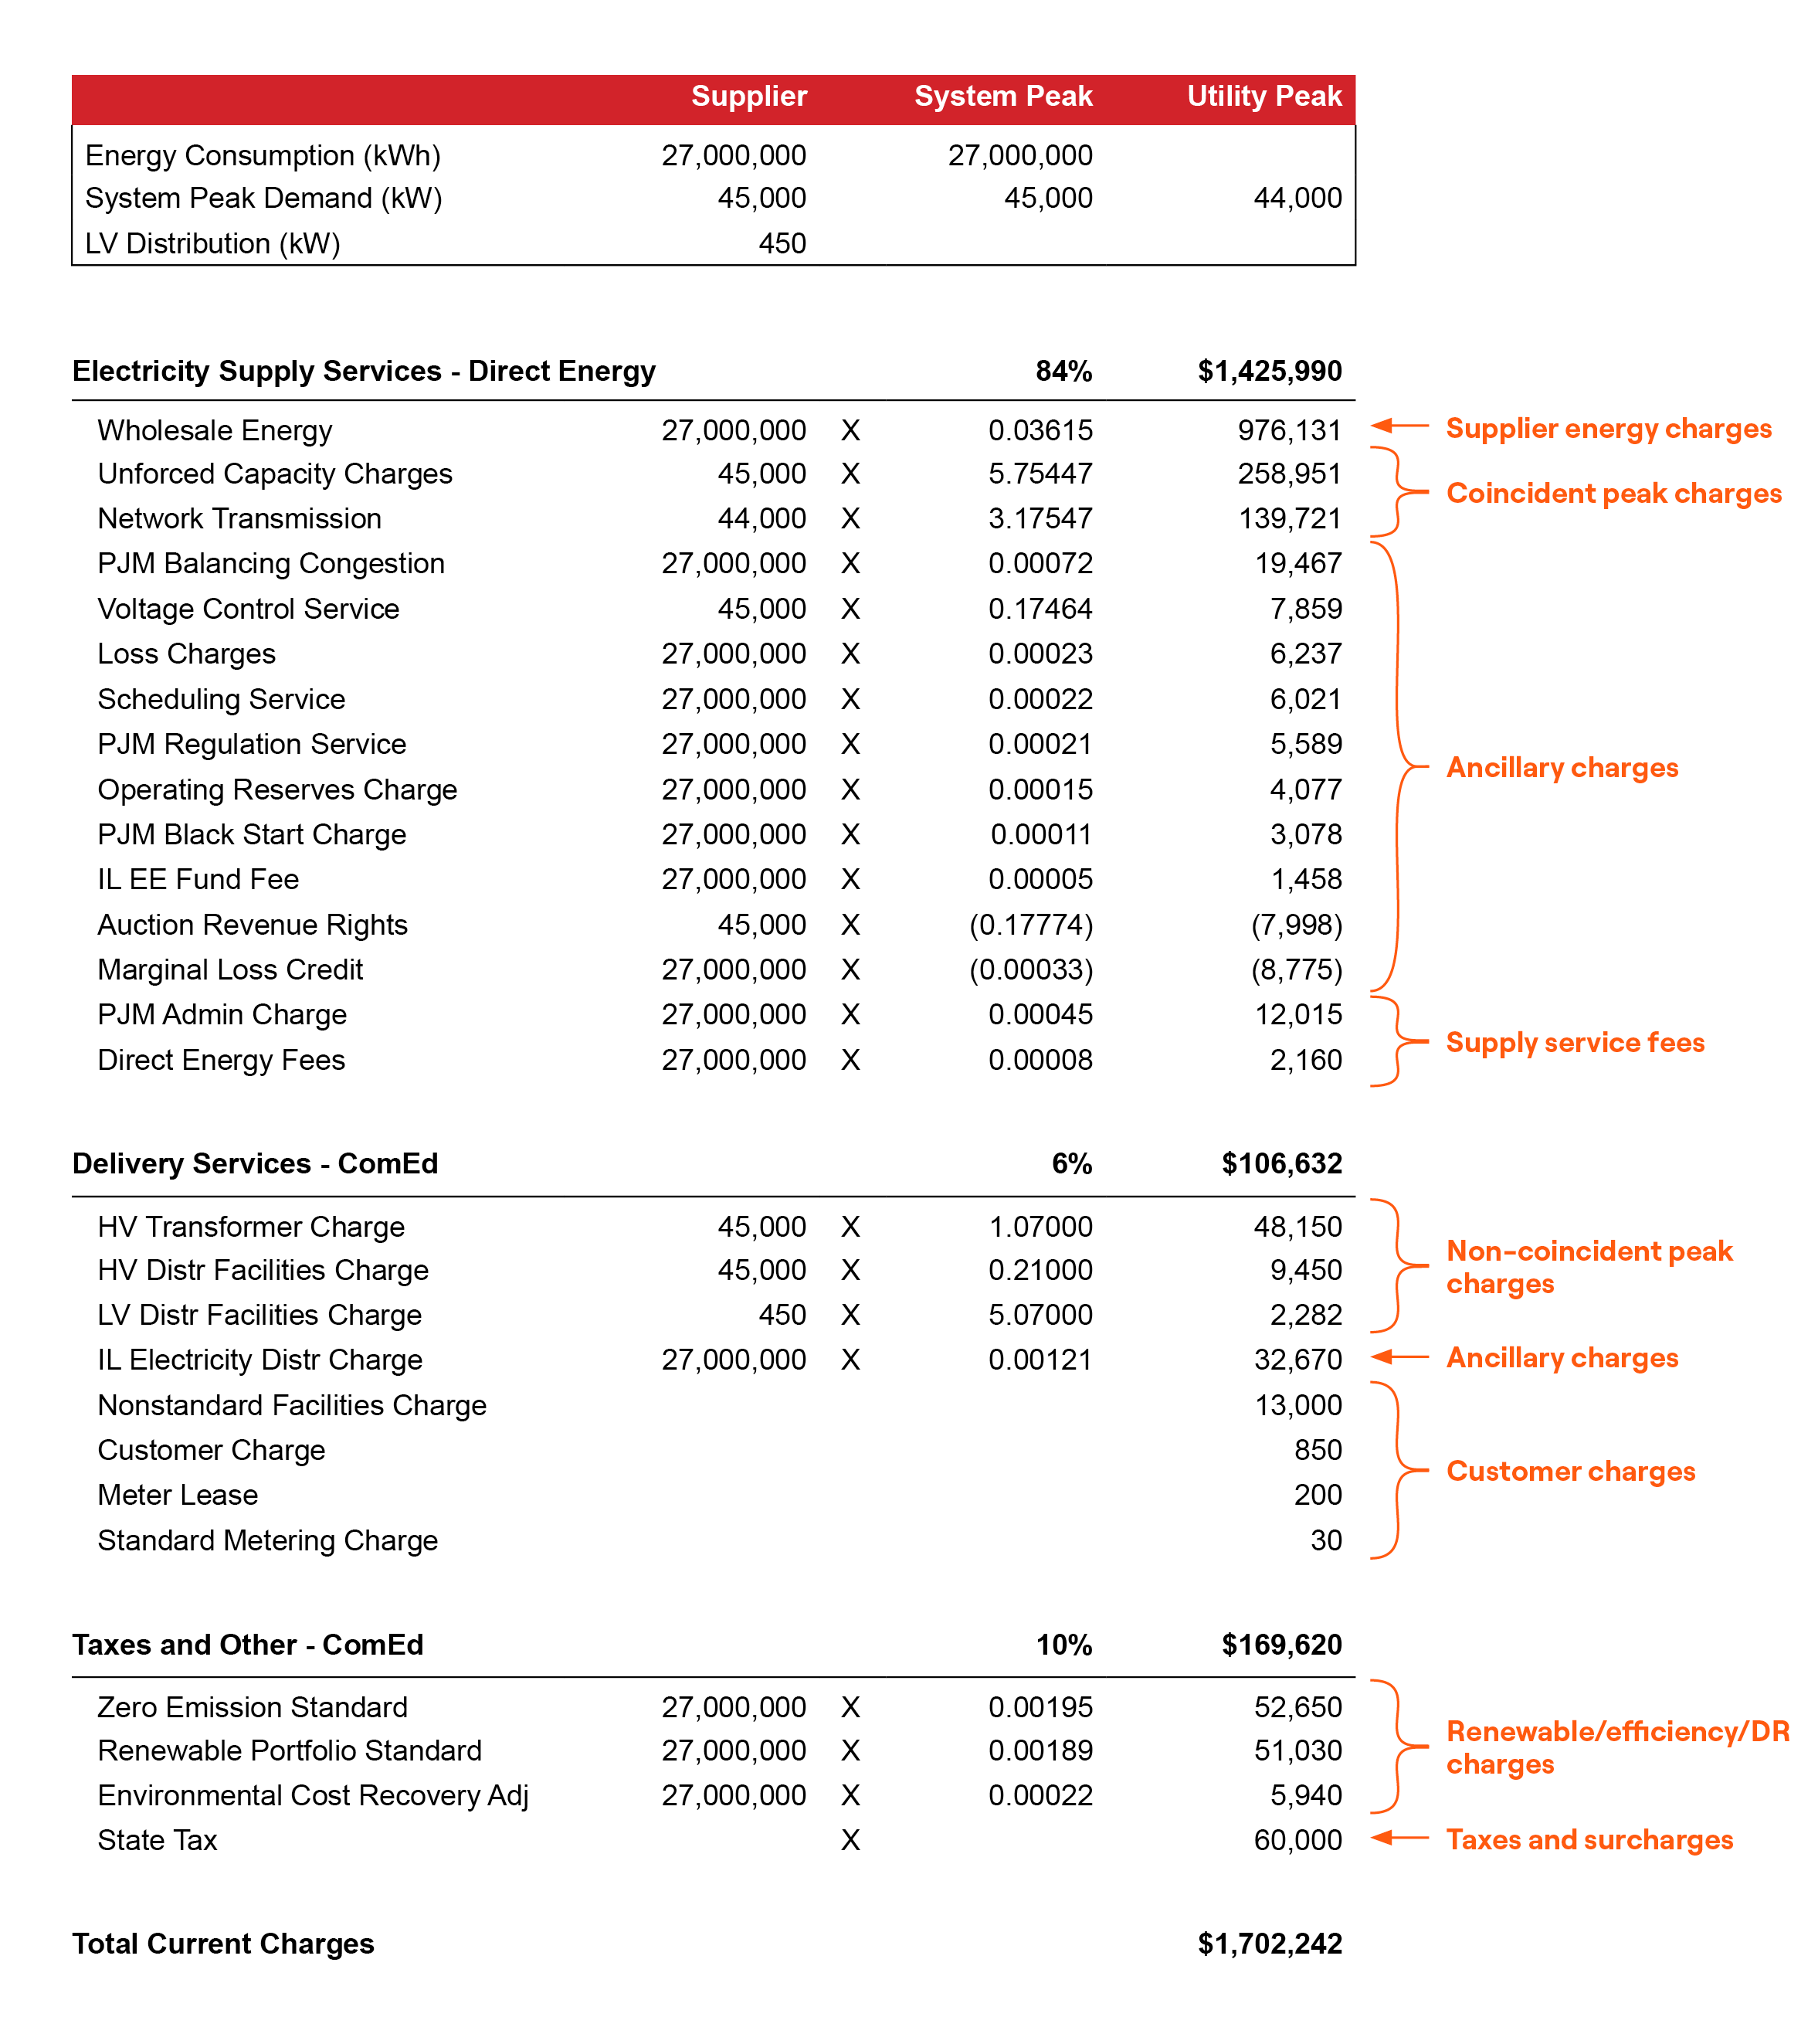
In this example, the customer experienced an energy consumption of 27 GWh (27,000 kWh) and a system coincident peak of 45 MW (45,000 kW) – let’s see what this means for their total electricity spend for the month. Again, this is an illustrative example, and may not show all possible items that could appear on your bill. Other regions and utilities may show different charges, but the general framework remains the same – energy, demand, and fixed charges can be found all along the value stream, from generation supply to delivery to the end-customer.
Breaking down the supplier bill: Direct Energy example
Where retail competition is available, you can purchase your electricity generation and transmission from a third-party supplier, typically at a discount to what you would pay to your local utility. In PJM, we recommend going with a supplier other than your utility, such that you are exposed to system coincident peak charges and can therefore manage your energy bills by reducing consumption during peak hours.
In this example, supplier charges consist of $976,000 of supplier energy charges, $399,000 of coincident capacity and transmission peak charges, $37,000 of ancillary services, and $14,000 of supply service fees. You can see in the illustrative bill the line-by-line items that comprise each of these charges.
What are these charges?
- Supplier energy charges: Charges to purchase the electricity supply through a combination of fixed and indexed rates.
- Coincident peak charges: Charges to purchase sufficient generation capacity and transmission capacity to meet end-customer demand during the coincident system peak. End users pay for the supplier’s commitment through capacity charges (UCAP) and transmission charges (TransCAP).
- Ancillary charges: Charges for services such as operating reserves, spinning reserves, regulation, black start, and frequency reserves. These charges help ensure the stability and reliability of the electricity grid.
- Supply service fees: Fees to cover suppliers’ cost to serve (e.g., operating costs, billing costs, credit risk, and profit margin).
Breaking down the utility bill: ComEd example
The remaining fees are to the utility for providing “last mile” distribution as well as for acting as the provider of last resort. In this example, non-coincident peak charges make up the bulk of the delivery services – totaling $60,000 over the month. This is followed by utility ancillary charges of $33,000 and customer charges of $14,000.
Beyond delivery, there are also taxes and program charges that reflect ComEd’s cost to support an array of programs to make the grid more efficient and reliable. Because these programs are not always aligned with maximizing profit for the utility, many regulators compensate utilities for lost profit by passing the program costs to end users.
What are these charges?
- Non-coincident peak charges: Charges for meeting facility demand during the peak kW reading of the month – these vary widely by customer class, industries, and load profiles, based on the tariff to which they are assigned. This is non-coincident in the sense that it does not need to occur during system peak hours.
- Utility ancillary charges: Like the system ancillary charges above but incurred by the utility for ensuring local reliability.
- Customer charges: Miscellaneous fees for providing last-mile delivery services, like customer, metering, meter lease, and other nonstandard facilities charges.
- Renewable/efficiency/DR charges: Charges for supporting renewable energy, energy efficiency, and demand response programs. These charges help fund programs that promote clean energy and energy conservation.
- Taxes and surcharges: Taxes and fees charged by the government – these vary depending on the facility location.
In aggregate, this customer is paying $1.7 million a month for 27 GWh of energy consumption – or much more if they were on a fixed energy supply rate from the utility, with no opportunity to curtail during system coincident peaks. In the next section, we explore some bill saving and revenue generating opportunities that this customer could consider implementing.
3 steps to reduce your energy spend
Now that you understand the different components of your organization’s energy bill, you can think of ways to make informed decisions about energy usage across your facilities and operations and tackle the various types of energy and capacity charges. As we’ve mentioned above, we can reduce total overall energy consumption and/or reduce demand during specific time windows. But how? Here are the 3 next steps we’d recommend.
First, get up close and personal with your energy data. Gaining visibility to your energy data will illuminate ways in which you can save money that you wouldn’t otherwise be able to identify. Looking at your real-time energy data will show you when your demand for electricity is greatest and will allow you to develop strategies for lowering those peaks, which will in turn lower your demand charges. If you have already taken measures to lower your peaks, and thus decrease demand charges, or lower overall electricity use (consumption), your data will indicate the impact of these efforts.
Second, consider no-cost or low-cost energy efficiency adjustments you can implement immediately. When you start up your operations in the morning, don’t just flip the switch on all of your high intensity equipment. Consider a staged start-up – turn on one piece of equipment at a time, create a schedule where the heaviest intensity equipment doesn’t all operate at full tilt simultaneously, and think about what equipment can be run at a lower intensity without adverse effect. You may use more kWh – resulting in greater energy consumption or a higher “energy odometer” reading as discussed above – but you’ll ultimately save on demand charges and your energy bill overall will be lower.
Finally, consider adding on-site solar or storage to help you better manage your energy usage. With on-site generation, you can generate electricity on-site from renewable sources such as rooftop or carport solar, which can reduce your grid consumption and lower your energy charges. With on-site energy storage, you can store excess energy during low-priced (off-peak) periods and using it during high-priced (on-peak) periods, lowering your demand charges. Beyond bill savings, there are also opportunities to earn payments for providing grid services that such distributed energy resources can unlock for you, through participating in programs like demand response.
Enel can help you with all the above. Learn more about the specifics of how you can take control of your energy costs. Contact our team today to learn how you can develop a tailored energy management strategy that unlocks bill savings by leveraging distributed energy resources.
